From the initial discussion of what our product would be, this is everything we have done, the alterations, and what we are considering for Mark II. Below is a list of all of the progress that has been made since the initial design presentation.
When we first started, we created the housing of the LED and sensor to be a finger box. However, we want it to be a clip to fit the traditional design. Additionally, a clip is more optimal because it doesn't force the user to sit completely still in order for our product to work. The first image is the finger box design and the second is the most up to date design created.

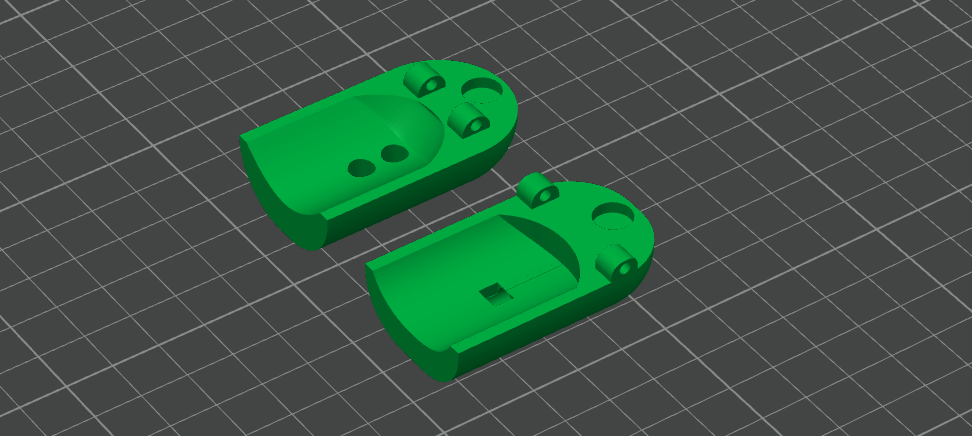
The finger box initially was printed twice and then tapped together to make it a box. The second design is superior compared to the inital finger box. The finger clip is fitted for the shape of a finger and clips on an axel. The circle indent in the back is for a spring so that the resting position of the clip is closed. Additionally, the whole for the LEDs are circular rather than square (so it fits better) and there is a hole in the back of the clip so the wiring is more clean and tight in the finger clip.
There was four main milestones completed for the code of our product. The first one was making the code from Arduino IDE into Python language. The purpose behind doing this is there are a lot of pythong packages with the purpose of filtering data and peak detection. The second milestone was adding a filter. This was so the wave was smoother and to remove any small noise. We applied the Savitzky–Golay filter. The way it works is that for a set amount of data points, it created a polynomial that best fits the curve that the points make. From there the filter applies the polynomial to smooth the data. The third milestone was creating peak detection. We applied a peak detection package in python and edited the parameters so that it fits how a heart beat behaves. The purpose is to make sure we are identifying the right peaks and not smaller peak made from noise. The forth milestone was utilizing the peak detection to calculate the BPM.
Attached below is the python code we are running currently. At the bottom of the page you can access the documents of the code that was in the Ardunio IDE before converting and the code in the Ardunio IDE currently so we can code in python.
# ============================================================
# 1) Imports
# ============================================================
from pyfirmata2 import Arduino
from scipy import signal
import numpy as np
import matplotlib.pyplot as plt
from collections import deque
import time

# ============================================================
# 2) Arduino Setup
# ============================================================
PORT = "COM3"        # sets up which port it reads from
ANALOG_PIN = 0       # A0
WINDOW = 200         # number of samples shown

board = Arduino(PORT)
board.samplingOn()

ms = 20     #ms between samples
board.setSamplingInterval(ms) #paces how much data gets sent in and graphed

data = deque([0.5]*WINDOW, maxlen=WINDOW) #value determines the starting values on the y-axis

def callback(value):
    if value is not None:

        inv_value = (-1)*value + 1

        data.append(inv_value)
        # print(inv_value)

board.analog[ANALOG_PIN].register_callback(callback)
board.analog[ANALOG_PIN].enable_reporting()

# ============================================================
# 3) Plot Setup
# ============================================================
plt.ion()
fig, ax = plt.subplots()

line, = ax.plot(range(WINDOW), list(data))
peaks_plot = ax.scatter([], [], marker='.')
bpm_text = ax.text(0.02, 0.95, "", transform=ax.transAxes)

ax.set_xlim(0, WINDOW-1)
ax.set_title("Pulseometer")
ax.set_xlabel("Samples")
ax.set_ylabel("Signal")

print("Reading A0...")

# ============================================================
# 4) Peak Detection
# ============================================================
from scipy.signal import find_peaks

def detect_peaks(y_smooth):
    peaks, _ = find_peaks(
        y_smooth,
        distance=25,      # minimum spacing between peaks
        prominence=0.003  # how much a peak must stand out
    )
    return peaks

# ============================================================
# 5) BPM Monitor
# ============================================================
FS = 1000 / ms

def calculate_bpm(peaks, fs):
    if len(peaks) < 2:
        return None

    peak_intervals = np.diff(peaks)      # difference in samples
    avg_interval = np.mean(peak_intervals)

    bpm = 60 / (avg_interval / fs)
    return bpm

# ============================================================
# 6) Live Plot Loop
# ============================================================
while True:
    y = np.array(data)

    y_smooth = signal.savgol_filter(y, window_length=11, polyorder=3, mode="nearest")
    line.set_ydata(y_smooth)

    #peak detection plotting
    peaks = detect_peaks(y_smooth)
    if len(peaks) > 0:
        peaks_plot.set_offsets(np.c_[peaks, y_smooth[peaks]])
    else:
        peaks_plot.set_offsets(np.empty((0, 2)))

    print(len(peaks))

    #bpm monitoring plotting
    bpm = calculate_bpm(peaks, FS)
    if bpm is not None:
        bpm_text.set_text(f"BPM: {bpm:.1f}")
    else:
        bpm_text.set_text("BPM: --")

    ymin = min(y_smooth)
    ymax = max(y_smooth)
    buffer = 0.15
    yrange = (ymax - ymin) if ymax != ymin else 0.1
    ax.set_ylim(ymin - buffer * yrange, ymax + buffer * yrange)

    fig.canvas.draw()
    fig.canvas.flush_events()

    time.sleep(0.05)
Most current circuit design shown below:
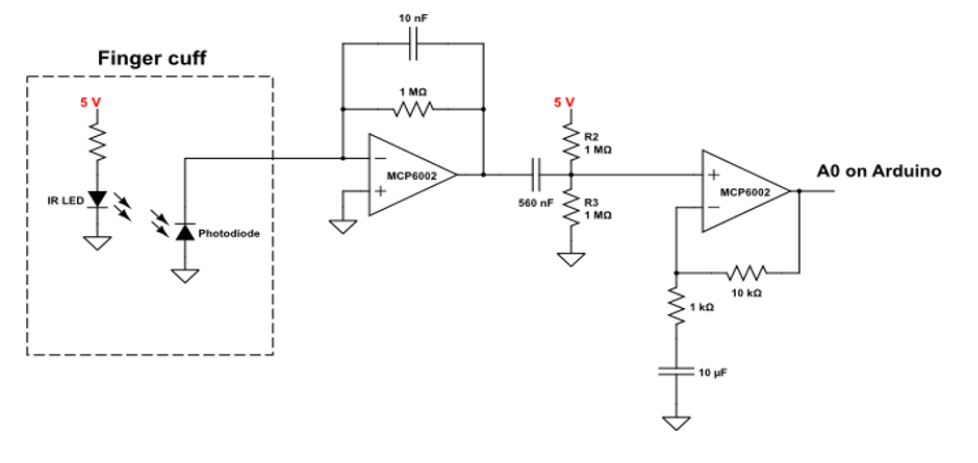
This circuit is made up of four components. Going left to right, the first component is the finger cuff, this is where the patient interacts with the device. The finger cuff will be in the shape of a finger clip, with the IR LED and the photodiode positioned on opposite sides of the finger. The photodiode converts light into electrical current with a high sensitivity and linearity, which is helpful for the small signals we are working with. The second component is the transimpedance amplifier (TIA). The current from the photodiode flows to the negative terminal of the op-amp and through the gain-setting resistor. This creates a voltage at the output of the op-amp that is proportional to the input current - the capacitor helps reduce noise. Next is a simple highpass filter; we are removing the DC baseline signal that comes from the natural absorbance and scattering from the tissue. The last component is a non-inverting gain op-amp. This amplifies the signal by a factor of R2/R1 (the ratio of the resistor in the feedback loop to the resistor connected to ground). The capacitor in this stage blocks the DC signal that we added in the previous stage, amplifying only the AC signal that we care about.
The goal of this whole process is to isolate the signal we care about (absorbance from oxygenated hemoglobin) and amplify it while removing background signal / noise. In this circuit there is already signal processing with multiple built-in filters, but there is more signal processing that has to happen in arduino. In order to remove background noise from the environment, we can use background subtracted signal. We blink the IR LED on and off (50-500Hz) and measure the signal in the on versus off state. Subtracting these two values will give us a reading that is roughly independent of the surrounding conditions - like ambient lighting or different placements of the device on the finger. Furthermore, in order to give a heart rate in bpm, it is necessary to real-time peak detection on the signal. This peak detection becomes very hard with noisy signal, but assuming we can tune our filter appropriately, this peak detection can be done with a simple cut off. If the signal is higher than some predetermined baseline and the signal goes from increasing to decreasing (instantaneous derivative = 0) then we can mark a peak. Time average between peaks gives the users real-time bpm.
During the inital report and now, we have changed components to help with making the signal stronger. The main difference is we have changed the resistance on the LED to be smaller so that the LED strength is larger. This was done because we kept on getting a smaller signal compared to the noise. So rather than reducing noise, we amplified the signal to get through more. Additionally there will be 2 LEDs rather than one. When we lowered the resistance, the LED started getting really hot which we saw as a potential hazard for user. So by adding a second LED and increasing the resitance a little bit, we get a similar result that we are looking for.
Our pulseometer, like commercial products, is based on photoplethysmography (PPG). PPG is an optical technique based on the Beer-Lambert law, and it can be used to measure physiologic information about a patient. When a patient’s skin is illuminated with specific wavelengths of light, the absorbance fluctuates in accordance with the flow of blood through that area of tissue. If one can measure this real-time absorbance, it is possible to extract information about not only heart rate, but blood oxygen saturation, respiratory rate, and even sleep quality
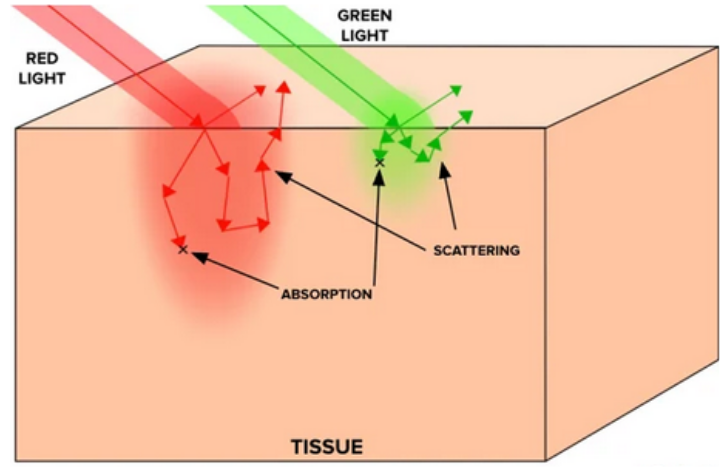
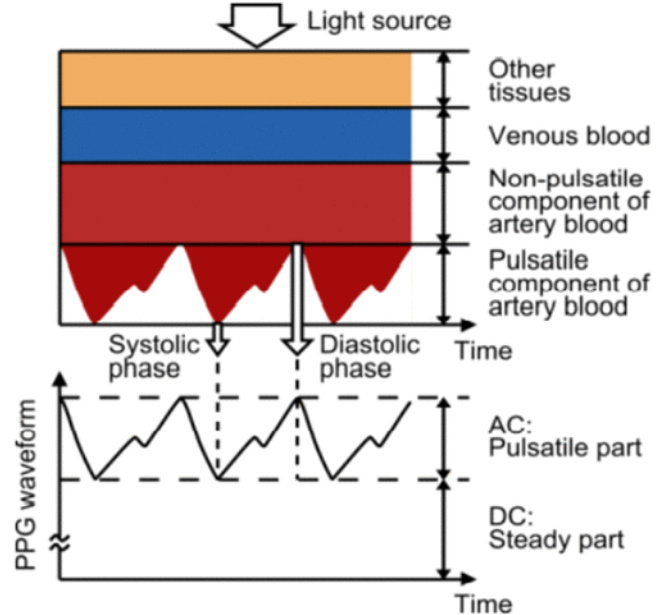
Our project will use transmittance PPG, where the light source is positioned opposite to the light collecting device, so the signal must travel through the appendage (fingertip) as demonstrated in the figure. In order to pick up small absorbance changes in pulsatile artery blood, we need to understand the optical properties of tissue and blood. Considering we are using transmittance PPG, light must be able to travel through the fingertip without getting completely absorbed or scattered out. Light scattering in tissue can be modeled with a power law relationship:
Depending on the tissue, b could be anywhere between 0.7-1.5. It is clear that as wavelength decreases, scattering increases, and we see a similar trend for absorption. Absorption follows the Beer-Lambert law:
Which can be re-expressed as:
Re-arranging the expressions above we see that μa ∝ cε. However, in tissue samples this becomes slightly more complicated, as the Beer-Lambert law assumes the presence of only one absorber. In skin and tissue there are many absorbers, so we can express this with a sum:
Each of these absorbers has slightly different molar extinction coefficients (melanin and other chromophores in the skin exhibit strong light absorption in the 200-500nm range, whereas water and lipids become more significant past 800nm). Absorbance is not as simple as scattering, but in general molar extinction coefficients for relevant organic molecules in the skin become stronger at lower wavelengths. Therefore if the goal is for light to travel all the way through tissue, it is more helpful to use a higher wavelength of light. It must still be a wavelength that can pick up on vascular activity; that is, it must be absorbed or scattered just enough so that we can detect a change when blood flow is occurring.
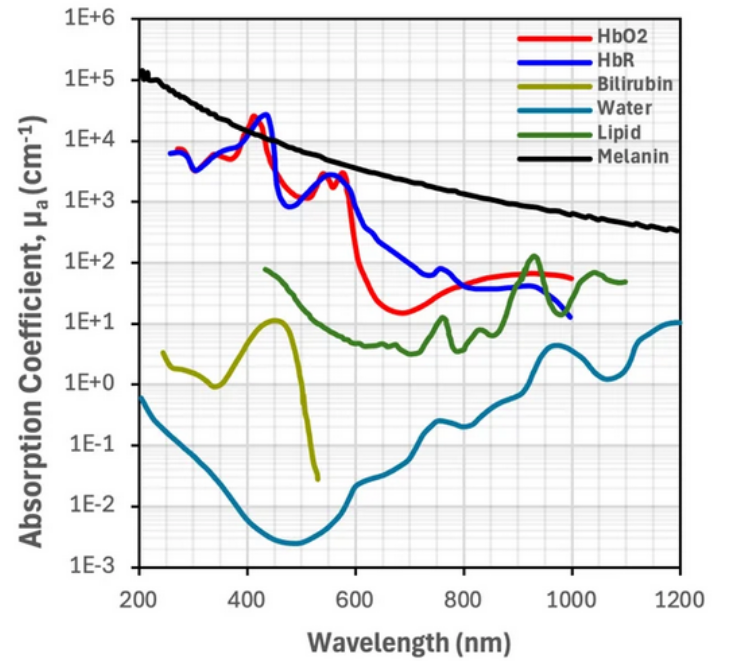
Deoxygenated and oxygenated hemoglobin absorb some wavelengths light equally (red-NIR), but some wavelengths differently, and this contrast allows us to collect absorbance data. Infrared light (850-1000nm) is more absorbed by oxygenated hemoglobin, while deoxygenated hemoglobin has stronger absorption of red light (650–750nm). In commercial devices, the difference between these absorbance ranges allows one to measure blood oxygen saturation. However, for the purpose of this device we will therefore be using infrared light, as it will have enough penetration depth into the tissue to be detected with transmittance PPG while also being sufficiently scattered / absorbed by oxygenated blood for us to detect it.